Learn · June 20, 2026
What KPIs Should HVAC and Plumbing Business Owners Track to Know If They Are on Track?
Discover what KPIs should HVAC and plumbing business owners track to know if they are on track and drive growth with proven performance metrics.
By The Catalyst Editorial Team Operator education · 11 min read · Updated July 24, 2026

Why Knowing Your KPIs Is the Difference Between Growing and Guessing
What KPIs should HVAC and plumbing business owners track to know if they are on track comes down to a focused set of 7-10 metrics that cover financial health, operational efficiency, sales performance, and cash flow. Here are the core ones to start with:
Core KPIs for HVAC and Plumbing Business Owners
| Category | Key KPI | Benchmark |
|---|---|---|
| Financial | Gross Profit Margin | 50-55% (40% minimum) |
| Financial | Net Profit Margin | 15% or higher |
| Financial | Accounts Receivable Turnover | 30 days or less |
| Operational | Revenue Per Technician Per Day | Target growth |
| Operational | First-Time Fix Rate | 80%+ |
| Operational | Jobs Per Technician Per Day | 3-5 |
| Operational | Average Ticket Size | Track weekly |
| Sales & Marketing | Booking Rate | Track weekly |
| Sales & Marketing | Customer Acquisition Efficiency | Optimize continuously |
| Retention | Maintenance Plan Renewal Rate | 70-80%+ |
| Cash Flow | Cash Runway | 8-12 weeks minimum |
Most HVAC and plumbing owners are busy. Vans are rolling, phones are ringing, and the schedule looks full. But a packed calendar does not always mean a profitable business. Revenue can grow while margins quietly shrink. A healthy bank balance today can mask significant supplier debt and a payroll cycle around the corner.
The problem is not a lack of data. Most field service software generates plenty of numbers. The problem is knowing which numbers actually matter — and checking them often enough to act before small issues become expensive ones.
This guide cuts through the noise. It covers every KPI category that matters for HVAC and plumbing businesses: financial, operational, sales, marketing, cash flow, and retention. It also explains how to set realistic benchmarks, build a review cadence that works, and turn the numbers into decisions you can act on.
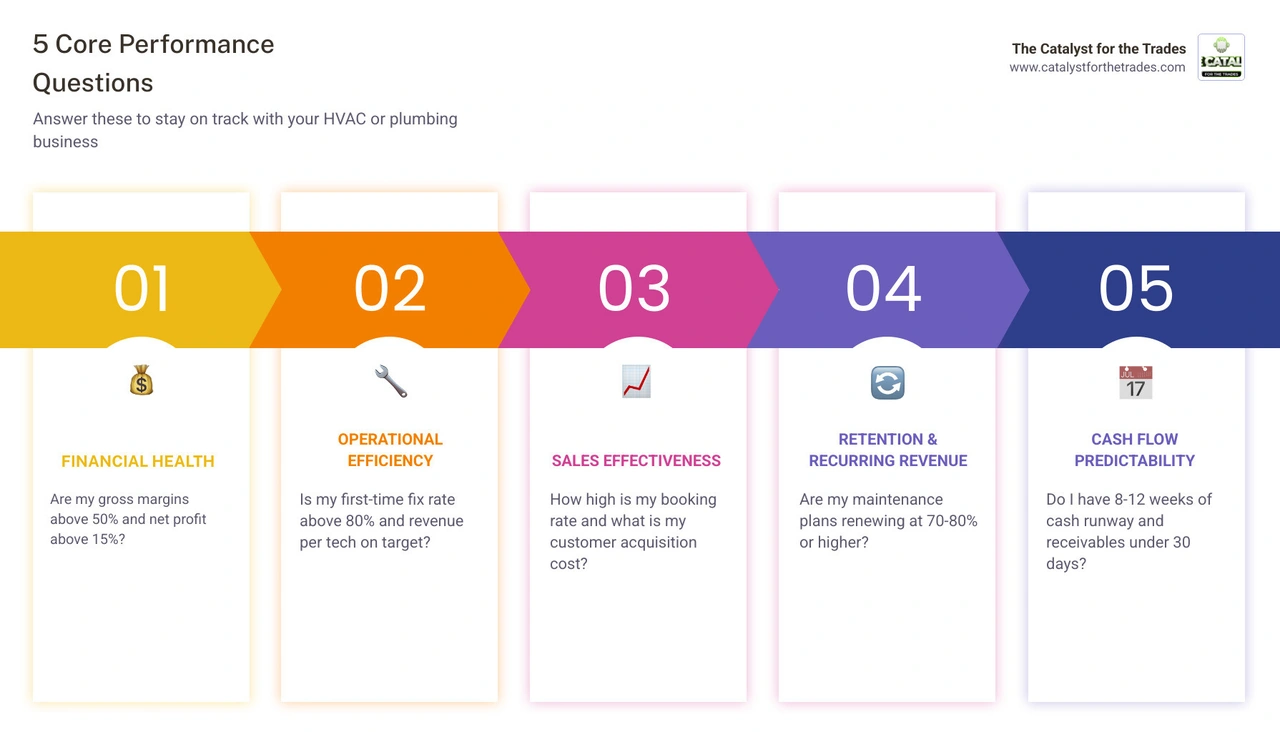
What KPIs Should HVAC and Plumbing Business Owners Track to Know If They Are on Track?

To build a sustainable, self-running home service business, we must move away from managing by “gut feel” and look at hard data instead. A number only becomes a true Key Performance Indicator (KPI) when it directly impacts our business decisions, is easy for our team to understand, and points toward a clear next step.
While both HVAC and plumbing businesses share similar operational foundations, their day-to-day metrics can look quite different.
| Metric Nuance | HVAC Businesses | Plumbing Businesses |
|---|---|---|
| Seasonality | Extreme demand spikes in summer and winter; quiet “shoulder seasons.” | Steady year-round demand with minor spikes during holiday freezes. |
| Job Mix | High-ticket system replacements mixed with routine maintenance. | High-volume service calls, drain cleanings, and emergency repairs. |
| Key Focus | Membership plan penetration to smooth out seasonal valleys. | Minimizing “$0 jobs” and maximizing first-time fix rates on service calls. |
Understanding these differences helps us tailor our tracking. If we look only at a combined revenue number, we miss the operational leaks that drain our profits.
Financial Metrics: What KPIs Should HVAC and Plumbing Business Owners Track to Know If They Are on Track?
When we look at the financial health of our business, our bank balance is a lagging indicator. To understand true profitability, we must track three core financial KPIs:
- Gross Profit Margin: This measures our efficiency in turning revenue into profit after accounting for direct job expenses (materials, equipment, and fully burdened technician labor). For residential service, a healthy gross profit margin is typically 50% to 55%, with 40% being the absolute minimum sustainable level. To get a handle on how to structure these numbers, check out our guide on Know Your Numbers: Grow Your Business – Financial Strategies for Trades.
- Net Profit Margin: This is what is left over to reinvest in the business or distribute to owners after all operating expenses, overhead, and taxes are paid. A healthy target for top-performing home service businesses is 15% or higher. That we must pay ourselves a market-rate salary before calculating this percentage, or our net profit is artificially inflated.
- Accounts Receivable (AR) Turnover: How fast do we get paid? For residential service, AR turnover should be 30 days or less—ideally, we should collect payment at the time of service. If we do commercial work or builder contracts, we must segment our AR days, as builders can drag payments out to 45 or 60 days, straining our working capital.
Tracking these numbers monthly keeps us from being surprised at the end of the year. For proactive planning and tax strategies that protect these hard-earned margins, read about How to Keep More of What You Earn: Year-End Tax Tips That Actually Work.
Operational Metrics: What KPIs Should HVAC and Plumbing Business Owners Track to Know If They Are on Track?
Our operational metrics tell us how efficiently our field team is running. If these metrics drift, our gross margins will quickly follow.
- Revenue Per Truck / Revenue Per Technician: Because our physical capacity is limited by the number of trucks we have on the road, this is a vital metric. A well-utilized truck in a healthy residential market should meet daily performance targets. If a truck falls below expectations, it is likely sitting idle in traffic, underbooked, or staffed by a technician who needs additional support.
- Jobs Per Technician Per Day: A healthy target for residential service is 3 to 5 completed jobs per technician daily. If this number is too high, technicians may be rushing, leading to callbacks. If it is too low, our dispatch routing may be inefficient.
- Average Ticket Size: Improving this ticket size is not about pushing unnecessary sales; it is about supporting technicians to perform thorough diagnostics and present clear options.
- First-Time Fix Rate (FTFR): The percentage of jobs completed correctly on the first visit. We should target 80% or higher (elite shops aim for 90%+). Every time a technician has to return to a home because they lacked a part or misdiagnosed an issue, it results in lost capacity and fuel. For a deeper look at optimizing these field operations, see our strategies on Increasing Service Margins.
Sales, Marketing, and Cash Flow Forecasting Metrics
Many owners assume that a drop in revenue means they have a “marketing problem.” In reality, the leak is often in how we handle the leads we already have. By tracking sales and marketing metrics alongside cash flow forecasts, we can pinpoint exactly where our pipeline is breaking down.
Measuring Sales and Marketing Effectiveness
To stop wasting money on poor marketing campaigns, we must track three specific metrics:
- Booking Rate: The percentage of inbound calls that our customer service representatives (CSRs) turn into booked service appointments. Top-performing shops convert over 85% of inbound calls. If our booking rate drops below 70%, we are paying to generate leads only to drop them at the phone.
- Conversion Rate (or Close Rate): The percentage of booked jobs where the customer approves a repair or replacement. This is highly dependent on the number of options presented. When technicians present clear “Good, Better, Best” choices, conversion rates and average tickets naturally rise.
- Customer Acquisition Efficiency (CAE): Total marketing spend divided by the number of new customers acquired. If our acquisition efficiency is lower than expected, we need to adjust our local SEO, review our Google Ads performance, or look into referral programs. To learn how to align these metrics, read our guide on KPI Tracking for Home Services.
Customer Retention and Recurring Revenue
It requires significantly more resources to acquire a new customer than to retain an existing one. In our industries, the ultimate retention tool is the maintenance agreement (or membership plan).
- Membership Penetration: The percentage of our active customer base enrolled in a maintenance plan. Strong residential operators target 35% to 50% penetration. These agreements provide predictable, monthly recurring revenue (MRR) that helps cover our fixed overhead during slow shoulder seasons.
- Maintenance Plan Renewal Rate: We should target a renewal rate of 70% to 80% or higher.
- Subscriber Churn Rate: The percentage of members who cancel their plans each month. We want to keep monthly churn under 5% to 8% for short-term plans, and under 2% for annual prepaid plans. If churn rises, it usually points to a lack of communication or a failure to deliver on promised annual tune-ups. Discover how to track these retention figures with our breakdown of Retention Metrics.
Predicting Cash Flow Problems Early
Eighty-two percent of small businesses fail due to poor cash flow management. In HVAC and plumbing, cash flow is highly seasonal. We must track these metrics to avoid seasonal shortfalls:
- Burn Rate: The amount of cash our business spends each week or month to cover fixed overhead (rent, office salaries, software) when no revenue is coming in.
- Minimum Cash Runway: How many weeks our business can survive at its current burn rate without any new sales. We recommend maintaining a cash runway of at least 8 to 12 weeks, especially heading into slow shoulder seasons.
- Receivables Days: The average number of days it takes to collect payments. Keeping this close to zero for residential retail work ensures we have the liquidity to pay suppliers and payroll on time. For practical cash management advice, read our Cash Flow Management Tips for Contractors.
Setting Realistic Benchmarks by Trade and Business Stage
Our targets must shift as our business grows. What works for a solo operator will break a scaling business.
- Early Stage (1–5 Techs): Focus is on stability. Owners should track weekly revenue, booking rates, and minimizing “$0 jobs” (calls that yield no revenue due to poor diagnostic processes).
- Growth Stage (5–20 Techs): Focus shifts to consistency. We must track technician utilization, average ticket sizes, and building our membership base to support growing overhead.
- Scaling Stage (20+ Techs): Focus is on efficiency and leverage. We monitor revenue per truck, labor efficiency ratios, and overhead percentages to protect our 15%+ net margins.
To learn how to plan your financial transitions across these stages, explore our resources on Financial Planning for Trade Businesses.
Implementing a KPI Review Cadence and Action Plan
Tracking KPIs is useless if we only look at them once a quarter when our accountant sends us a P&L statement. That is like driving a truck by only looking in the rearview mirror. To make data-driven decisions, we must establish a consistent review cadence.
Establishing a Review Cadence to Avoid Analysis Paralysis
We do not need to track every metric every day. To keep from getting overwhelmed, we recommend breaking our KPIs into a simple schedule:
- Daily (15-Minute Huddle): Review the previous day’s booking rate, revenue per truck, and jobs completed. This keeps the team aligned and allows us to spot dispatch or scheduling gaps immediately.
- Weekly (Leadership Meeting): Review lead volume, close rates, technician utilization, and pending job aging. This is where we adjust our marketing spend or schedule quick alignment sessions for technicians whose average tickets are slipping.
- Monthly (Financial Review): Review our full P&L, gross margin by division (install vs. service), AR days, and maintenance plan churn. This is where we verify that our operational activity is actually translating into net profit.
- Quarterly (Strategic Planning): Review our cash runway, year-over-year revenue growth, and progress on long-term goals.
Turning KPI Data into Actionable Decisions
When a KPI drifts, it is a symptom of an underlying issue. Here is how we turn common KPI warnings into clear business decisions:
- Declining Gross Margin: If our gross margin drops below 50%, we must audit our job expenses. Are material expenses rising? Are technicians taking too long on installations? We may need to update our service guide. For guidance on setting profitable rates, see our Service Strategies for HVAC Companies.
- Low Technician Utilization: If technicians are billable for less than 75% of their day, we have a scheduling or routing problem. We may need to cluster our service calls geographically to reduce travel time.
- High Callback Rate: If callbacks rise above 10%, we have a quality control or support issue. We should pause and invest in technician development before we lose customer trust.
Frequently Asked Questions
What is a healthy gross margin for HVAC and plumbing companies?
For residential service and repair, a healthy gross margin is 50% to 60%. For larger installation and system replacement work, a healthy gross margin is 30% to 40%.
Because service and install have completely different expense structures, we should never blend their margins in our reporting. Blending them hides the truth and can lead us to miscalculate our installation work or service calls.
What KPIs do new owners commonly ignore until it is too late?
New owners often focus entirely on top-line revenue and ignore these silent profit killers:
- Callback Rate: Rework represents hidden capacity loss. A callback impacts the diagnostic time, the technician’s labor, and the opportunity of a job we could have booked instead.
- Warranty Reserve Trends: We must set aside a portion of our revenue (typically declining from 25% to 15% as our systems mature) to cover future warranty claims. Failing to hold a reserve can lead to a massive cash drain when older systems require service.
- Parts & Subcontractor Expense Ratio: Unmonitored parts spending and rising subcontractor invoices can quietly eat away our margins if we do not audit them monthly against our service guide.
How do digital dashboards and field service tools help track KPIs?
Using modern field service management (FSM) software like ServiceTitan or Housecall Pro allows us to capture clean data directly from the field. When integrated with automated dashboards and professional bookkeeping, these tools give us a real-time view of our business.
Instead of spending hours building manual spreadsheets, we can see our daily performance at a glance, allowing us to make decisions based on facts rather than feelings.
Conclusion
Knowing what KPIs should HVAC and plumbing business owners track to know if they are on track is the first step toward building a business that supports your life rather than consuming it. By tracking a focused set of financial, operational, and sales metrics, you can stop guessing and start leading with confidence.
At The Catalyst for the Trades, hosted by Jennifer Bagley and Chuck Staszkiewicz, we combine cutting-edge technology insights with real-world operational experience to help home service businesses scale. Ready to take control of your numbers and build a predictable growth engine? Read our Ultimate Guide to Contractor Business Strategy to get started.


